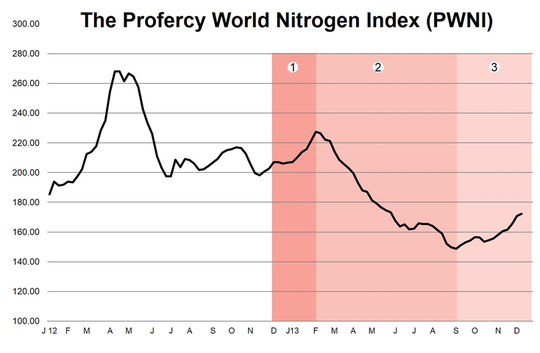
As the holiday season approaches, this extended blog entry briefly reviews the fortunes of nitrogen products throughout 2013. Utilising Profercy’s World Nitrogen Index, the review primarily focuses on urea, which makes up the majority of nitrogen used worldwide. 2013 saw nearly 7 months of falling urea prices sandwiched between two bullish phases.
For more information on global nitrogen prices, covering all major products and markets, you can request a trial of Profercy’s daily news, weekly analysis and monthly forecasting. For more information, please click here.
1) A positive start saw prices rise in all urea markets
The year began positively for urea producers. Supply problems in North Africa and the anticipation of demand for major markets in the West saw a run up in urea prices in all areas from December 2012 through to early February 2013. Indeed, Egyptian granular prices reached over $500pt fob while Black Sea prilled urea prices rose by $60pt from end December to early February.
Reflecting the strength in urea markets, the Profercy World Nitrogen Index rose from nearly 207 on 3 January 2013 to over 227 on 7 February. It is worth noting that during this period Yuzhnyy ammonia prices slightly countered the gains from urea and bucked the trend for most nitrogen products. While the PWNI rose from early January to early February, Yuzhnyy ammonia fob prices fell by over $30pt with October 2012 prices of over $650pt fob a distant memory.
2) Bad weather defers demand as Chinese product impacts world urea prices through to Q3
Producers’ fortunes turned for the worse in March with poor weather in major Western markets delaying the spring season and deferring demand. With other markets relatively inactive and with product committed, oversupply in import markets saw prices plummet. The US Gulf granular urea price fell $90pst between early February and April. While UAN and AN remained firm for another month, prices soon fell.
Despite supply problems in North Africa, the global urea market continued to be oversupplied through Q2. Over a million tonnes of Chinese product entered the market in the first half of 2013, up from nearly zero in 2012, with markets anticipating the availability of further Chinese product from July. In China, lower costs and increased urea production, coupled with a poor domestic season, encouraged producers to move high levels of urea to ports ahead of the low export tax window in July. The availability of this material ultimately flooded a market already in decline.
Q2 began with the Nitrogen Index just below 200 points with a near continuous drop until September when the Nitrogen Index hit a floor at just over 148 points. During this period Middle East granular prices fell by well over $100pt.
3) October onwards: production cutbacks, reduced Chinese stocks and increased demand
By the end of September, the urea market appeared to have bottomed out. Key stabilizing factors were; supply cutbacks by high-cost producers; reduced flow of Chinese products to the ports; and increased demand from India, Latin America and Europe. Since October, the Nitrogen Index has increased by over 20 points. Ammonia markets in the West again held back the Nitrogen Index slightly with a drop in Yuzhnyy ammonia prices seen from mid-October to mid-November. However, these prices stabilised by end-November.
How does 2013 compare to previous years?
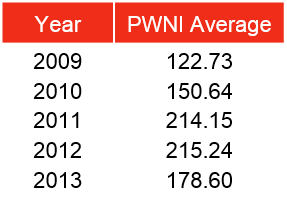
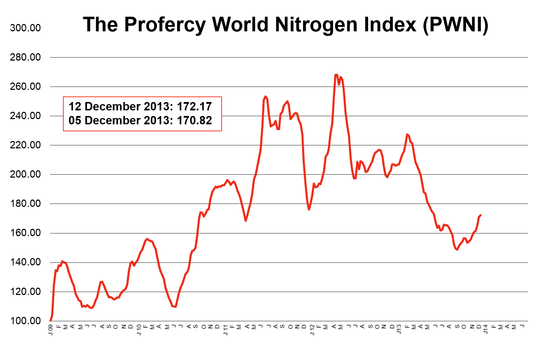
Since the inception of the Profercy World Nitrogen Index, the index average has increased year on year with 2013 being the only exception. 2012’s average was over 90 points greater than in 2009 when global nitrogen markets felt the force of the global economic slowdown. The chart below, setting out the Nitrogen Index since 2009, portrays the recovery from June 2010 onwards, a recovery that came to an end in Q1 2013.
identifies this trend, taking into account the seasonal volatility witnessed in global nitrogen markets.
What is clear is that 2013 has bucked this trend, with prices generally down on the back of new capacity coming on stream and with Chinese exports playing a greater role.
The Profercy World Nitrogen Index is published every week and is based on price ranges provided by the Profercy Nitrogen Service. This includes prilled and granular urea, UAN, AN, ammonium sulphate and ammonia.
Profercy’s Nitrogen Service includes daily news, weekly analysis and monthly forecast reports. For more detailed information on specific products and individual markets, please sign up for a free trial or for more information on the Profercy Nitrogen Service, please click here.
The methodology behind the Profercy World Nitrogen Index can be found here.


